Welcome to the third and final installment in our MEL Blog Series. Our first post covered developing learning frameworks and the second highlighted a foundation’s approach to MEL.
When it comes to monitoring, evaluation, and learning (MEL), we often fixate on quantitative data, prioritizing results as numbers. While these data are useful to answer program-related questions regarding what, when, where, and how many, they don’t fully address questions around how or why.
Enter qualitative data.
Qualitative data can provide rich stories and evidence to help us understand how and why change happens over time. Qualitative methods acknowledge humanity in MEL by accounting for small, yet significant, behavioral shifts within complex systems.
Using Outcome Mapping to Capture Nuance
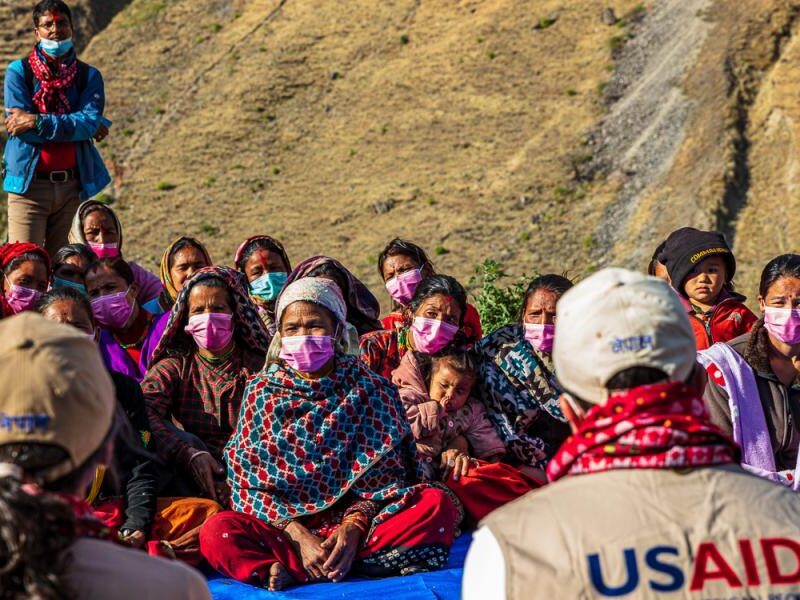
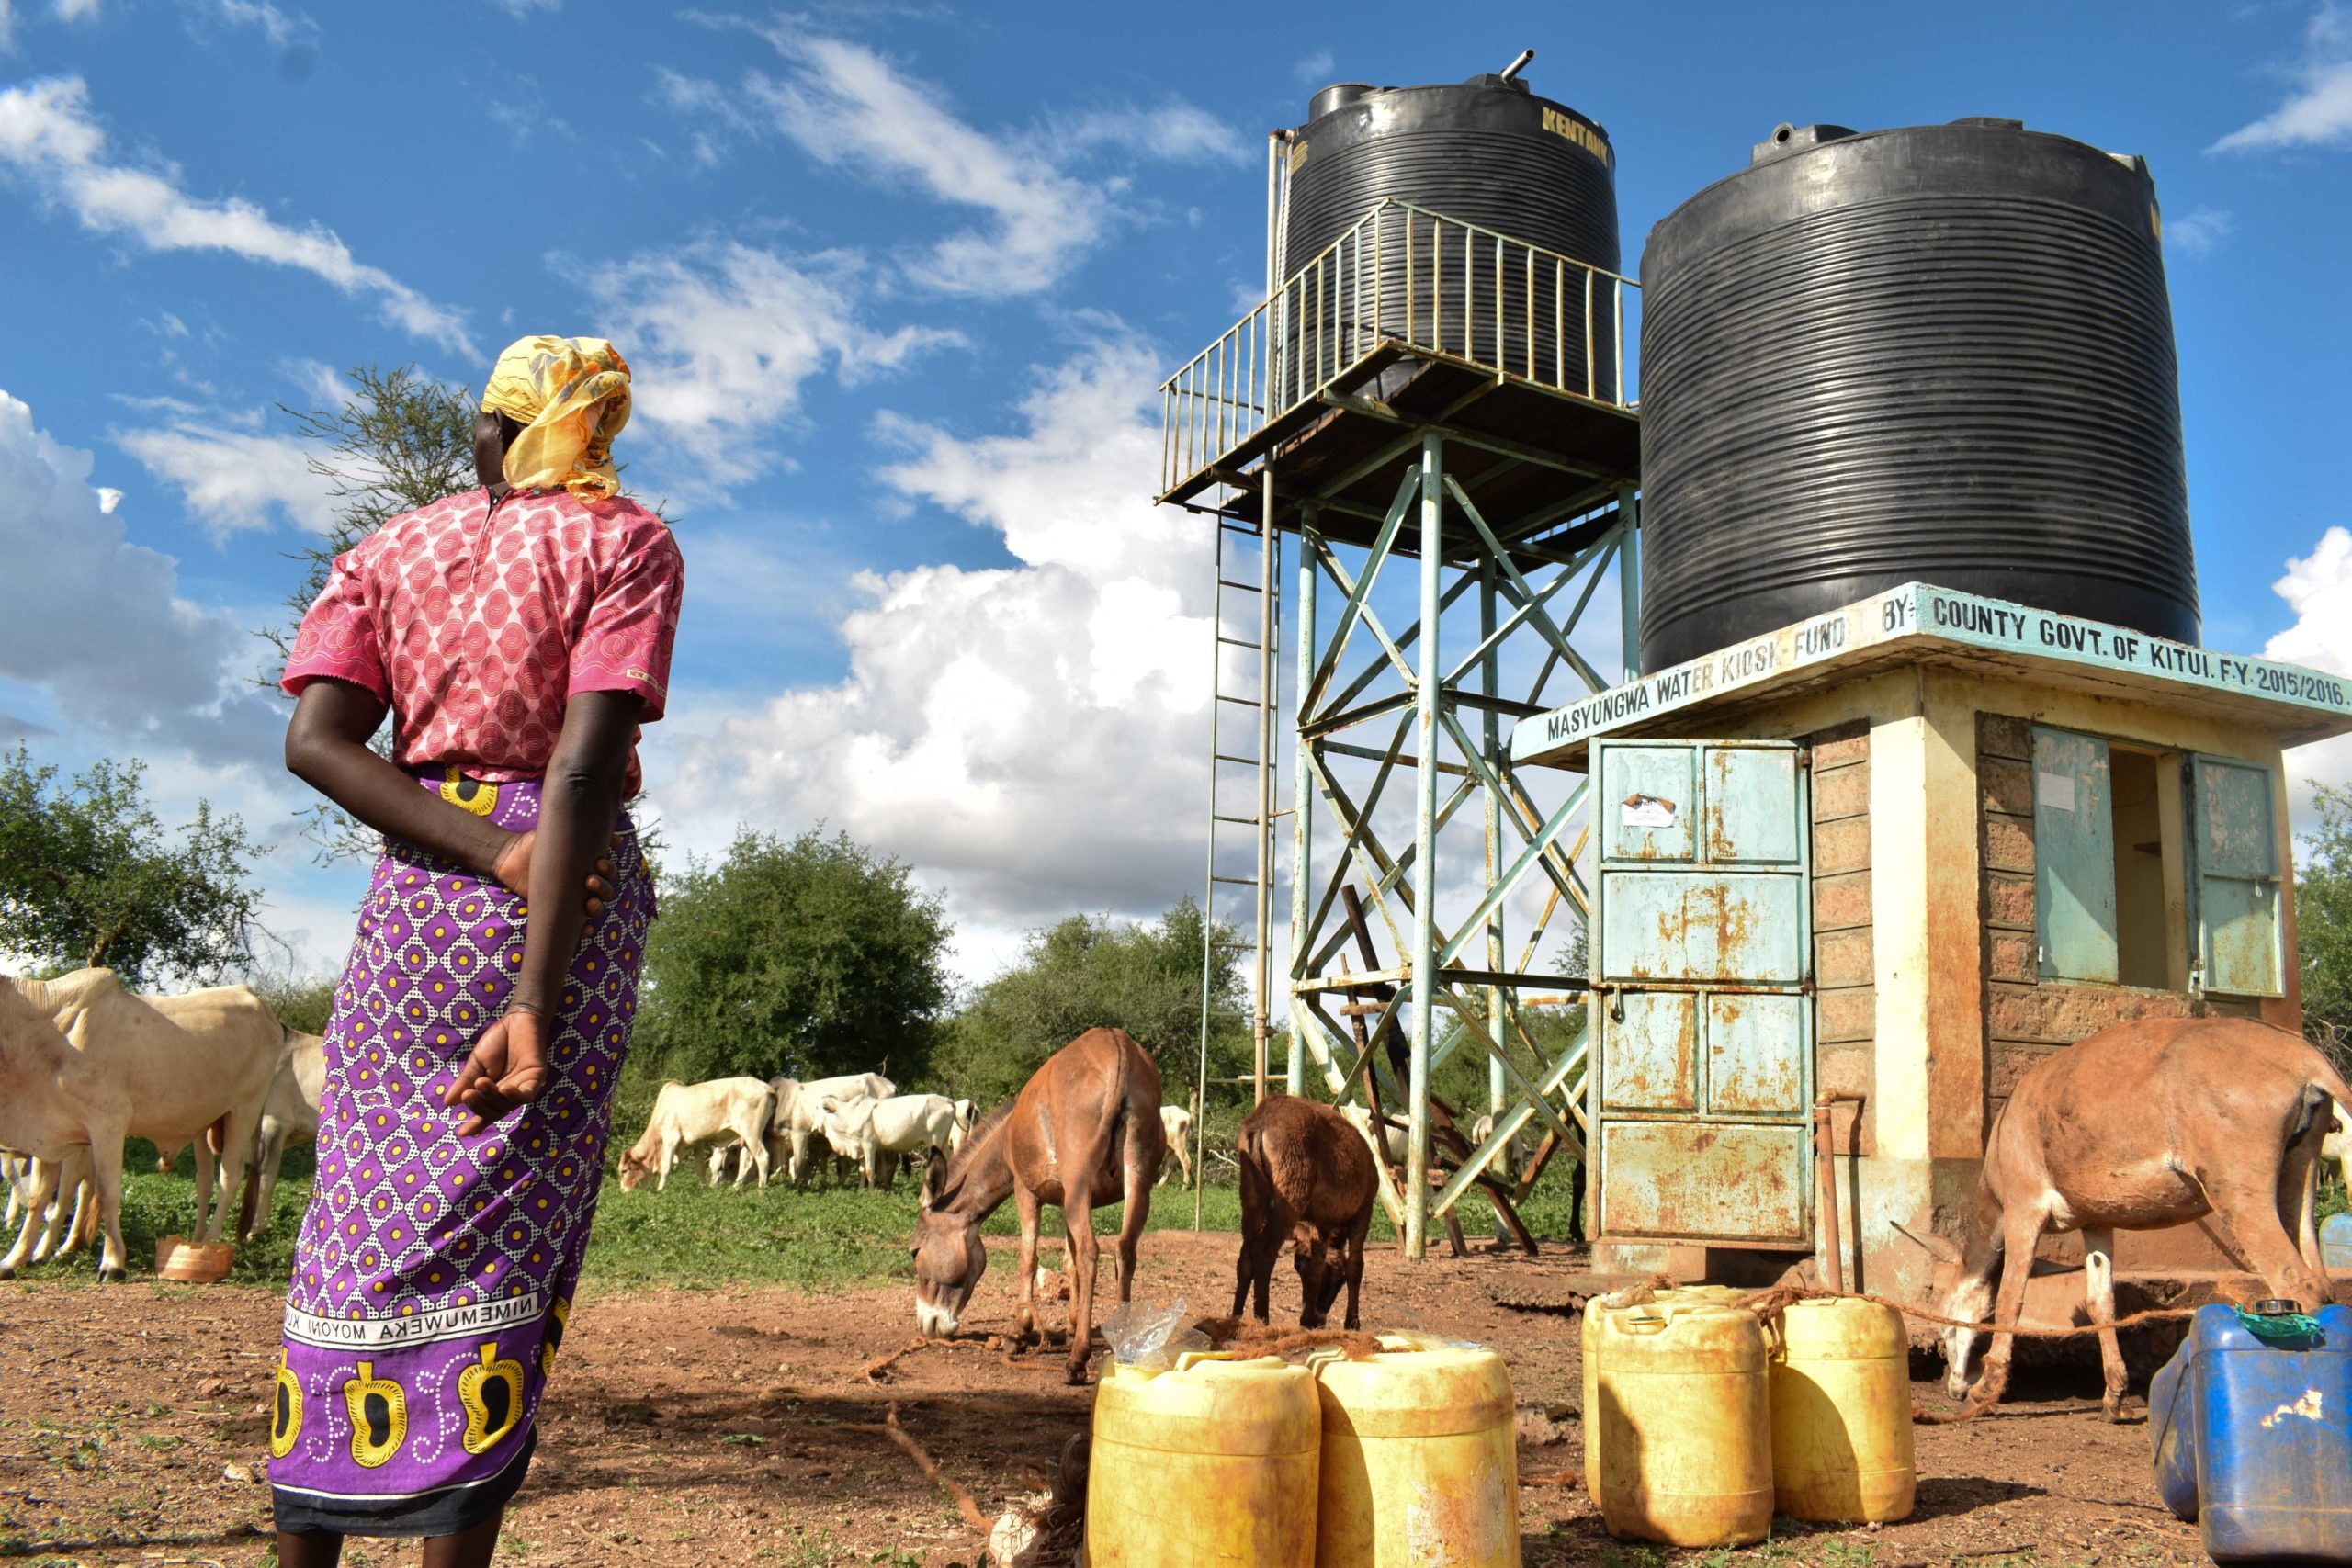
Capturing how and why change occurs is foundational to understanding systems, as evidenced by the Sustainable WASH Systems Learning Partnership (SWS) funded by the U.S. Agency for International Development (USAID). Since 2017, the eight-member SWS consortium has been developing, demonstrating, learning about, and sharing evidence on systems-based approaches to improve the sustainability of water, sanitation, and hygiene (WASH) services in Ethiopia, Uganda, Cambodia, and Kenya. As a learning partner, Environmental Incentives collaborates with consortium members to capture stories of systemic change through MEL.
SWS primarily relies on outcome mapping, a comprehensive qualitative methodology, in tandem with routine quantitative data collection, to capture nuanced information. This dual approach enables SWS teams to regularly synthesize observations regarding project goals to find and reflect on emerging trends and themes.
The Why: Identifying and Explaining Trends
SWS partners use progress markers to guide reporting on incremental individual and organizational behavior change. Team members regularly journal observations of those markers and then comb through the full data set biannually to reflect on and highlight relevant information.
Whave, an SWS partner organization, works to professionalize water hand pump maintenance systems and services across Uganda and provides preventive maintenance in over 600 rural communities. Elizabeth Buhungiro, Whave Solutions Communications and Learning Coordinator, describes how outcome mapping provides context to explain the why behind quantitative trends in hand pump maintenance systems and services:
“If we talk about the number of communities decreasing [contract renewals] exponentially in a certain reporting period, what explains that trend? What explains the fact that communities have not signed [a service agreement]? The explanation is in the qualitative data that we collect through journaling.” Elizabeth emphasizes that “trends are important for us to have on record for strategic planning, even if you already know it from on-ground experience.” Her own reporting captures the changes, the trends and, ultimately, the project’s story. This iterative process leads to contextualized stories of the change process itself, providing invaluable information to learn from SWS activities.
The How: Outcome Mapping in Action
Beyond identifying the why behind quantitative trends, outcome mapping enables SWS partners to capture how program results are achieved. For example, Whave advocates for political candidates to promote sustainable rural water services over traditional (and often unreliable) one-time rehabilitation during their campaigns.
During the lead up to the 2021 national election cycle, a community declined to renew its contract with Whave anticipating that campaigning politicians would provide the needed funds for one-time repairs. However, as a result of Whave’s advocacy, the local candidate refused the community’s request unless the money went towards a contract renewal with Whave. Two months later, the community renewed the contract and organized to collect two thirds of the necessary funds to supplement the candidate’s contribution.
If SWS relied on quantitative reporting alone, this rich story would have been reduced to a single number: one service contract renewed. Instead, outcome mapping allowed SWS partners to gather, monitor, and evaluate long term metrics in tandem with the storied context of what it can take for communities to sign or renew contracts.
Looking Forward
Now in its fifth and final year, SWS is drawing on the stories collected through outcome mapping to share lessons with the broader WASH sector. As Kimberly Pugel, a Graduate Research Assistant at SWS partner organization University of Colorado at Boulder, notes, “outcome mapping shows how the small changes along the way ultimately turn into and contribute to more profound change.” With outcome mapping, Kimberly can “understand specific coalition dynamics and processes,” a key insight for her research on factors driving collaborative approaches.
From contracts renewed to the number of functioning pumps, quantitative data provides us with critical numbers for monitoring, learning, and evaluation. However, qualitative methods, such as outcome mapping, capture the nuances of complex systems to create a full picture. As a result of the SWS Partnership’s mixed-methods approach, program implementers, researchers, and community members alike can share and learn from the rich stories collected to create lasting solutions for sustainable WASH services.
For more details about SWS qualitative methodology, see the Measuring Systems Change in WASH Programming report.